Level 1
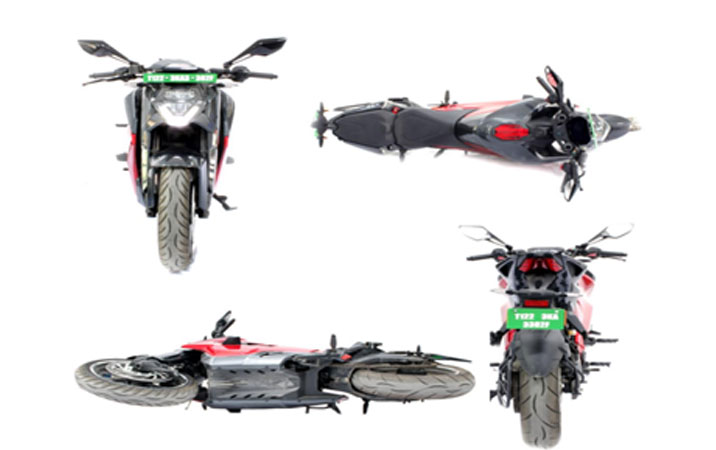
- 4 side photographs
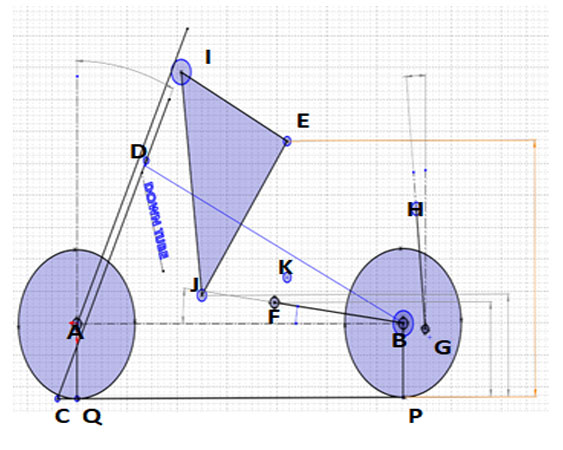
- Part size (L /W / H)
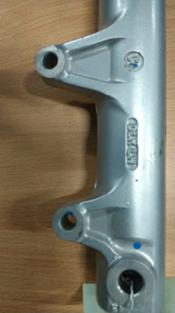
- Part weight
- Mounting details
To understand the perceived cost (customers' willingness to pay) for features when buying a vehicle, we analyse competitors' product specifications and features. This analysis is conducted through surveys using random sampling, stratified random sampling, hypothesis testing, and data analysis.

Facilitate your vehicle procurement and part-level sourcing seamlessly with our tailored solutions, accommodating project-specific requirements. Whether sourcing locally or internationally, we handle the entire procurement process, from identifying the right vehicles and components to ensuring a smooth logistics process, including customs clearance.

At CAPCP, we understand the importance of meticulous documentation before a vehicle teardown. Our pre-teardown services ensure that every detail is captured accurately, providing a solid foundation for subsequent analysis and work. We conduct detailed vehicle measurements, including exterior dimensions such as length, width, height, and overall exterior dimensions to ensure precise documentation. We also measure individual components and check the alignment and positioning of various parts to understand their original placement. Our photography services include capturing multiple angles of the vehicle's exterior, detailed images of the interior focusing on key components and overall condition, and close-up shots of critical parts and components to highlight their condition before teardown.

Tear down is a specialized task in automotive benchmark. Tear down reveals the key components and features of a vehicle or system, which is required to set target for the new vehicle development. Most of the vehicle manufactures spend lot of resources and time in teardown activities to get the most out of benchmarking activity.
We at CAPCP have understood the importance of teardown, which helped us to identify the step by step activities in a teardown. This is classified as Pre teardown, on teardown and post teardown.
Benchmarking is always been the key milestone of any product development process. We at CAPCP has experienced this and working on various techniques for effective bench marking. Our experienced team can do benchmarking in 3 levels. Each level of benchmarking has its own benefits.
Tear down is a specialized task in automotive benchmark. Tear down reveals the key components and features of a vehicle or system, which is required to set target for the new vehicle development. Most of the vehicle manufactures spend lot of resources and time in teardown activities to get the most out of benchmarking activity.
We at CAPCP have understood the importance of teardown, which helped us to identify the step by step activities in a teardown. This is classified as Pre teardown, on teardown and post teardown.
The process involves the systematic examination and comparison of materials used in vehicle components. We analyze the performance, durability, and efficiency of these materials, assisting manufacturers in setting benchmarks and making informed decisions.
| RAW MATERIAL | ||
|---|---|---|
| Rubber | Lucaena | |
| Proximate analysis | ||
| Moisture (%) | 11,02 | 8.14 |
| Ash (%) | 2.87 | 2.93 |
| Volatile Matter (%) | 69.97 | 64.27 |
| Fixed Carbon (%) | 16.14 | 24.66 |
| RAW MATERIAL | ||
|---|---|---|
| Rubber | Lucaena | |
| Ultimate analysis | ||
| Carbon (%) | 44.25 | 45.74 |
| Hydrogen (%) | 5.74 | 6.11 |
| Nitrogen (%) | 0.41 | 0.46 |
| Oxygen (%) | 41.27 | 45.35 |
At CAPCP, we conduct a variety of tasks as part of our static benchmarking process, including feature analysis, HMI validation, ergonomic study, vehicle safety study, utility and usage study, gap and flushness assessment, system layout, harness schematic development, component location layouts, switch and sensor specifications, E&E component specifications, battery and motor packaging, scanning, geometric dimensions, hardpoints, and vehicle dimensions.


At CAPCP, we conduct a variety of tasks as part of our static benchmarking process, including feature analysis, HMI validation, ergonomic study, vehicle safety study, utility and usage study, gap and flushness assessment, system layout, harness schematic development, component location layouts, switch and sensor specifications, E&E component specifications, battery and motor packaging, scanning, geometric dimensions, hardpoints, and vehicle dimensions.


Zero-Based Costing (ZBC) meticulously calculates costs by analysing every activity in the manufacturing process and evaluating prices at each elemental level. This approach involves creating detailed decision packages that justify every expense, ensuring efficient resource allocation and transparency.
| Description | UOM | Mud Flap | Rear Mudguard | Mud Flap RR | Mud Flap Dust cover | Rear Middle Mudguard | Chain Guider | Chain guard | Handle Grip LH | Seat Latch |
|---|---|---|---|---|---|---|---|---|---|---|
| Images | NA |  |  |  |  |  |  |  |  |  |
| Raw Material-Grade RM-Data File | NA | PPCP | ABS | PPCP | EPDM | PP | EPDM | PP | Silicon Rubber | ABS |
| Net Weight(kg) | Kg | 0.085 | 0.286 | 0.12 | 0.036 | 0.268 | 0.158 | 0.122 | 0.078 | 0.054 |
| No of Cavity | Nos | 1 | 1 | 1 | 2 | 1 | 1 | 1 | 1 | 1 |
| Cycle Time | Sec | 80 | 80 | 80 | 80 | 80 | 120 | 80 | 120 | 120 |
| Efficiency | % | 85% | 85% | 85% | 85% | 85% | 85% | 85% | 85% | 5% |
| Projected Area (A) | Sqmm | 111250 | 310000 | 156420 | 23290 | 216631.6 | 76646 | 166554 | 16416 | 10134 |
| Injection pressure (P) | N/Sq.mm | 65 | 138 | 65 | 8 | 65 | 8 | 65 | 8 | 138 |
| Tonnage (T) = (A * P)/(C * K) | Tons | 360 | 2180 | 520 | 100 | 720 | 160 | 560 | 40 | 80 |
| Machine Rate/8Hrs | INR | 5040 | 21800 | 5200 | 1400 | 7200 | 2240 | 5600 | 800 | 1600 |
| Production/Shift | Nos | 304 | 304 | 304 | 608 | 304 | 200 | 304 | 200 | 200 |
| Gross Weight | Kg | 0.0935 | 0.3146 | 0.132 | 0.0396 | 0.2948 | 0.1738 | 0.1232 | 0.0858 | 0.0594 |
| Raw Material Cost (A) | INR | 10.48 | 39.48 | 14.80 | 11.71 | 33.06 | 51.38 | 13.81 | 32.78 | 7.45 |

Excess material between calliper mounting holes

No excess material between calliper mounting holes
Comments : Due to less mounting pitch of caliper, rib is required. Idea not accepted
Material removal between calliper mounting holes
Value Analysis
Value analysis we are providing enhance services by identifying and eliminating unnecessary costs, improving functionality, and ensuring quality, primarily during the manufacturing phase. It fosters innovation and better performance by systematically evaluating all components and processes involved.
Value Engineering
Value engineering is a proactive technique focused on enhancing the design or process of new products or services during the early stages of development. This approach aims to prevent issues, encourage innovation, and add value by optimizing functionality and efficiency before production begins.
| Design Optimization | |
|---|---|
| Design For Manufacturing | ✓ |
| Design For Assembly | ✓ |
| Material Efficiency | |
|---|---|
| Alternate Material | ✓ |
| Material Waste Reduction | ✓ |
| Process Improvement | |
|---|---|
| HRM / Process Optimization | |
| Power Reduction / (Tonnage) | |
| New Packaging | |
| Supply Chain Optimization | |
| Fasteners Reduction | |
| Product Improvement | |
|---|---|
| New Features | |
| Commonality | |
| Improved Quality | |
| Comfort | |
| Weight Reduction | ✓ |
| Cost Reduction | ✓ |